
Shared platform / Analytics
See the question behind the number.
Bring financial and operational information into views with dates, sources and useful next steps.
Analytics / a clearer practice viewIllustrative
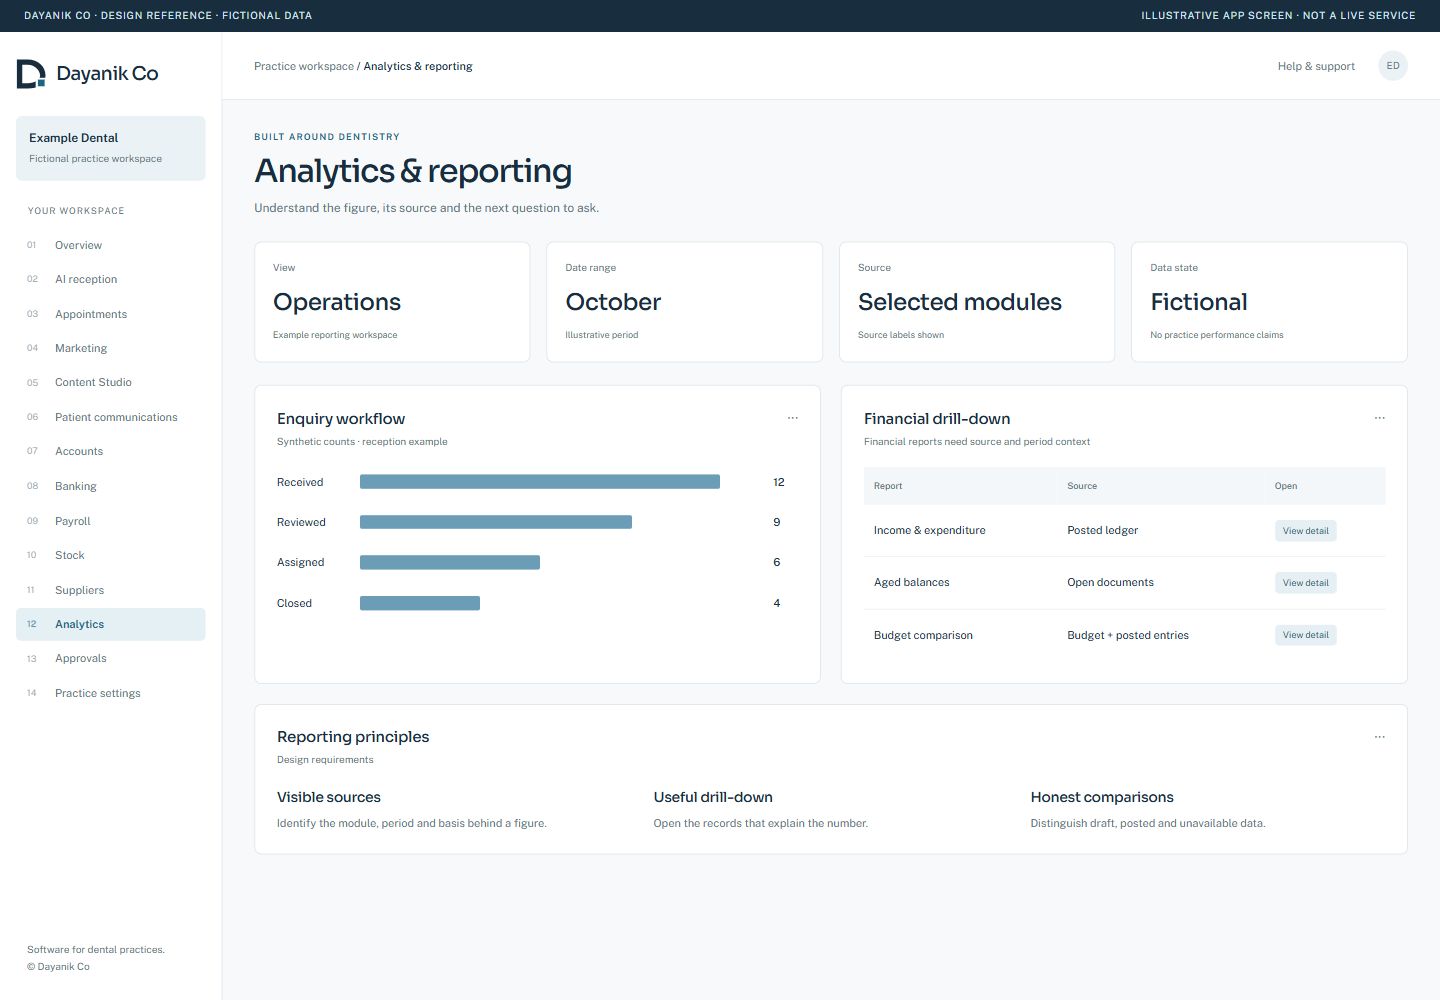 View screen
Analytics, in view.Illustrative interface · fictional records. Select the image to inspect the screen.
The work it supports
A closer look
at the working day.
- Financial reports and selected operational/KPI sources.
- Date ranges, ledger/budget/prior-year comparisons where implemented.
- Reporting context that identifies the underlying source.
Analytics / workflow exampleFictional
Step 01 / illustrative
Choose the question
Select the period and reporting context.
EXAMPLE PRACTICEReview record / EX-01Source context → staff review → next action
Website demonstration only. Switching steps does not save records, post accounts, run payroll, place orders or contact external services.
Availability, supported scope & connections
Available insight depends on configured and validated data sources. No patient-conversion, savings or performance outcome is promised. Dayanik is in development. Hosted acceptance and onboarding are agreed before use. Screens are identified as development screenshots or illustrations; fictional records are used throughout.
Start with your practice
Show us the work
you want to make easier.
Choose your priorities. We’ll discuss the supported workflows, setup and the right next step for your team.